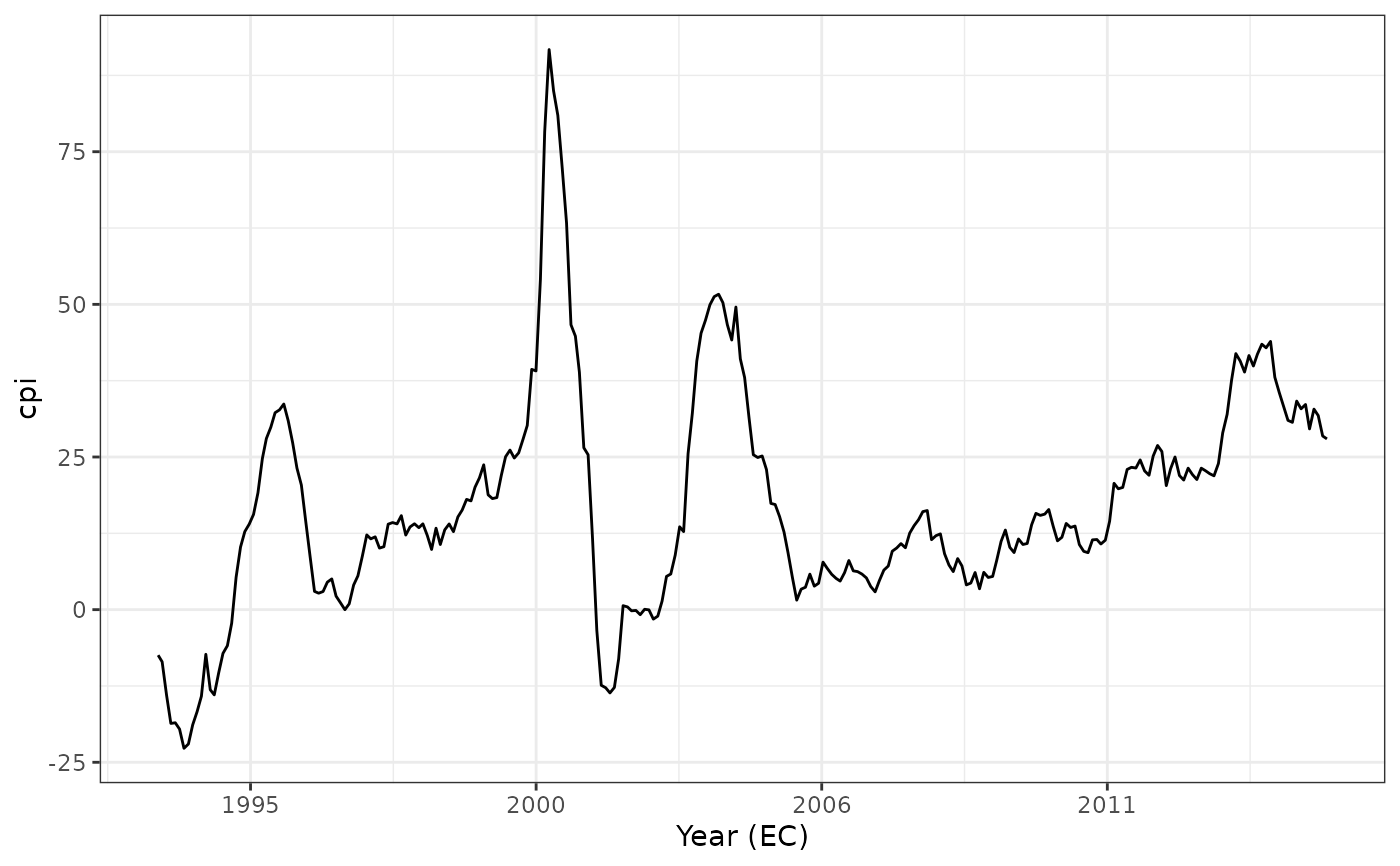
Helper functions to plot an ethdate object using ggplot2.
Usage
scale_x_ethdate(breaks = eth_breaks(), labels = eth_labels(), ...)

scale_y_ethdate(breaks = eth_breaks(), labels = eth_labels(), ...)

eth_breaks(n = 5, pretty = TRUE)

eth_labels(format = "%b %d, %Y", lang = "lat")
Arguments
- breaks
A numeric vector of positions or
eth_breaks()function.- labels
A character vector giving labels (must be same length as breaks) or
eth_labels()function.- ...
further arguments to be passed to
ggplot2::scale_x_continuous()orggplot2::scale_y_continuous().- n
A number of breaks.
- pretty
Logical; if TRUE, use pretty() for rounded breaks.
- format
A format for the
ethdate.- lang
A language for the month or weekday names if involved. Use "lat" for Latin alphabets "amh" for Amharic alphabets, and "en" for English names.

